Overview & Motivations
- A few months ago, I came across the following graphic on the right, within an online discussion forum.
- Comparing average cumulative returns of SPX, it suggests that one can achieve greater returns if they were to invest in the SPX at all time highs rather than on any day.
- This seems rather counter intuitive and it challenged my understanding of markets.
- Following this, I wanted to back-test a few strategies to see if this could actually apply to an everyday investor or if it is merely a statistical result and perhaps a little misleading.
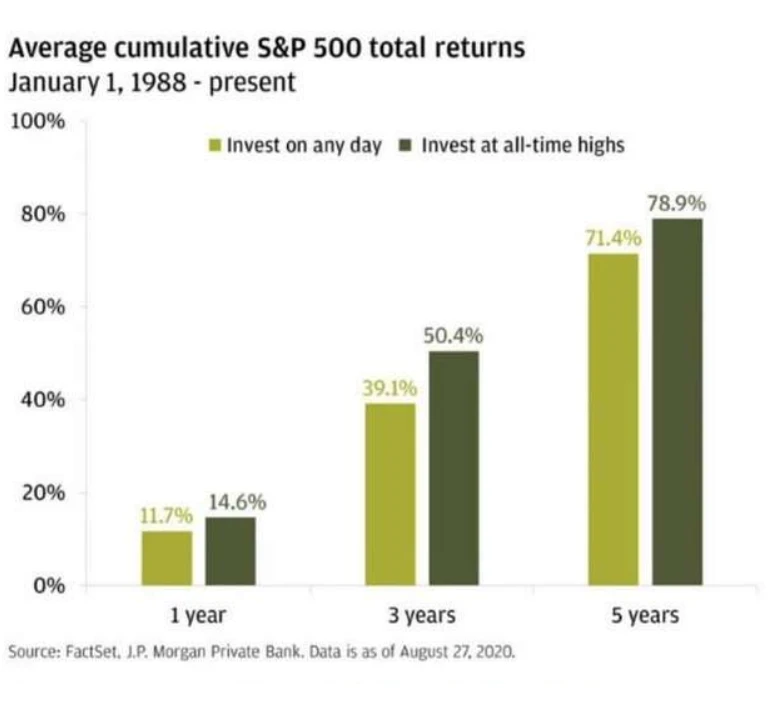
Average cumulative S&P 500 total returns: investing on any day versus at all-time highs. Original graphic and its source credit, reproduced from the presentation.
The strategies
- To test if dollar cost averaging only when the market is at all time highs, I have back tested the following various strategies. Each have been tested from the 1st May 1980 to the 7th July 2025
- DCA at ATH
- $1 invested everyday the SPX close is at an ATH
- DCA at ATH
- If the SPX closes at an ATH, $1 is invested for that day and every day before that for which there wasn’t an all time high reached.
- Practically, this would mean an investor would save one dollar, every day they are not investing
- E.g. if there was an ATH reached and this hasn’t happened for 5 days, the amount invested would be $5
- Standard DCA strategy
- Simply $1 invested everyday into the SPX
- DCA at anything BUT an ATH
- $1 invested everyday into the SPX on everyday it doesn’t reach an ATH.
Results
| Strategy | DCA at ATHs | DCA at ATH – Buildup | Standard DCA | DCA on anything but an ATH |
|---|---|---|---|---|
| Amount invested | 946 | 11386 | 11387 | 10441 |
| Ending value | 11118 | 126152 | 139131 | 128012 |
| Total return since May 1980 | 1075% | 1008% | 1121% | 1126 |
| CAGR | 8.22% | 8.01% | 8.35% | 8.37% |
Values and labels reproduced as shown in the original table.
Key Takeaways
- So, contrary to what the first graphic would make you believe, investing at ATH’s alone, actually deliver a lower return than if an investor was to stick to a standard DCA strategy.
- This is exactly what you would expect intuitively.
- Originally, I viewed the first graphic as a method of overcoming the psychological barrier of investing into markets when it is reaching ATHs and what seems like unreasonable valuations.
- This case study certainly readjusts that point of view. However, the difference in the returns between each strategy is small, and given the difficulties with timing the market, investing at a close price (and knowing that price is the close price), and dry powder complications (if you don’t invest on a particular day then what should you do with it?), should suggest that an investor should remain with a standard DCA strategy.
- I unfortunately did not have access to the data backing of the original graphic; however, I think it was driven mainly by a momentum factor. Simply cherry picking ATHs mostly misses large periods of negative and stagnant returns, during which an investor would need to put their funds elsewhere and can simply not time-travel and pick a different period to invest in.