Overview
The following is a look into how daily leveraged ETFS (2x and 3x) perform relative to their underlying index. In this case we will look specifically at the S&P 500 Index (SPX) from 1980 onwards
- Most market indices with leverage have not been active long enough to track their performance through major market crises and periods of strong volatility. To understand how they may have performed through these periods, we will look into four different time periods:
- 1980 to today,
- 2000 to today (to analyse the effect of the dot com bubble)
- 2007 to today (to analyse the effect of the GFC)
- 2020 to today (to analyse the effect of the COVID-19 pandemic and following market volatility)
- This will include looking into both a plain and simple price growth back-test, and a DCA strategy of buying $1 of stock in the respective index at every single close
- Additionally, to check the validity of this study, comparisons to traded leveraged ETFs from their start dates have been included
Keep in mind:
- This data does not account for management fees or other irregularities. The data is simply the S&P 500 index close price (since 1980), the daily return was then multiplied by the leverage multiplier to get the respective return of the leveraged index. Each time period case study starts with the equalising of prices across funds to be equal to the SPX close of that first day
- All data is as of 23rd June 2025 following market volatility such as the Trump administration’s Liberation day tariffs and heightened Iran-Israel-US tensions
- Past performance is not indicative of future results, these cases are merely to look into what has previously happened to leveraged indexes, to examine their risks. It is not at all a recommendation of these investments.
What is a leveraged ETF?
- A leveraged exchange-traded fund (ETF) such as Direxion Daily S&P 500 Bull 3× Shares (SPXL) seeks to deliver three times the S&P 500’s daily percentage change; if the index rises 1 % in a session, SPXL targets a 3 % gain, and vice versa for a loss.
- The multiplier is achieved through a basket of total-return swaps, index futures, and short-term borrowing, amplifying exposure without purchasing additional equities outright.
- The fund resets its leverage at each market close, rebalancing derivatives so the next trading day again starts at roughly the same exposure.
- Because leverage is reset daily, multi-day holding periods experience path-dependent compounding: in volatile markets, returns can deviate materially from three times the index’s cumulative move, a phenomenon often called volatility drag.
- Expense ratios and swap financing costs are higher than for conventional index ETFs; SPXL charges 0.95 % annually, and bid-ask spreads can widen during turmoil.
- Designed primarily for short-term tactical positioning or hedging, they are usually unsuitable as a long-term core holding owing to volatility drag, increased turnover, and elevated costs.
- However, could this potentially lead to greater returns if held for a longer period of time?
Volatility Drag
- When a leveraged ETF like SPXL resets its exposure to 3× each day, gains and losses compound on an ever-changing base; large swings up and down reduce the geometric (cumulative) return even if the underlying index finishes flat
- In a 2-day example where the S&P 500 rises +2 % on Day 1 and falls -2 % on Day 2, the index ends roughly unchanged (-0.04 %), but SPXL targets +6 % then -6 %, leaving it down about -0.36%
Plain Back-testing
- The following charts show the change in price for an investor that was simply to buy and hold from the starting date
- 1980 – today: a mostly upward, relatively calm four-decade path allows the 3x series to snowball to ~201k versus the index’s ~6k; the compounding of leverage outweighs volatility drag over such a long, benign trend
- 2000 – today: launching at the top of the dot-com bubble injects two deep bear markets (2000-02 and 2008-09). 3x end-value (~5.4k) under the index value (~6k) and both fall short of 2x (~9.3k): the larger the drawdowns, the harsher the drag on higher leverage
- 2007 – today: beginning just before the GFC tells the same story, 2x (~12.1k) beats 3x (~11.2k) but both here beat the underlying index
- 2020 – today: 3x leads (~9.4k vs ~8.6k for 2× and 6k for the index)
- Across all, the leveraged lines swing far more violently, highlighting the drawdown risk investors take on for the chance of amplified gains.
- The charts underscore a core principle: daily-reset leveraged ETFs multiply today’s return, not the whole period’s. Their ultimate performance is therefore path-dependent. Extended bull runs can overpower costs, while choppy markets impose “volatility drag”
- Values shown exclude dividends, management fees, and swap financing costs, so real-world funds like SPXL or SSO would track these lines directionally but finish a little lower
Buy-and-hold: 1980 – Today
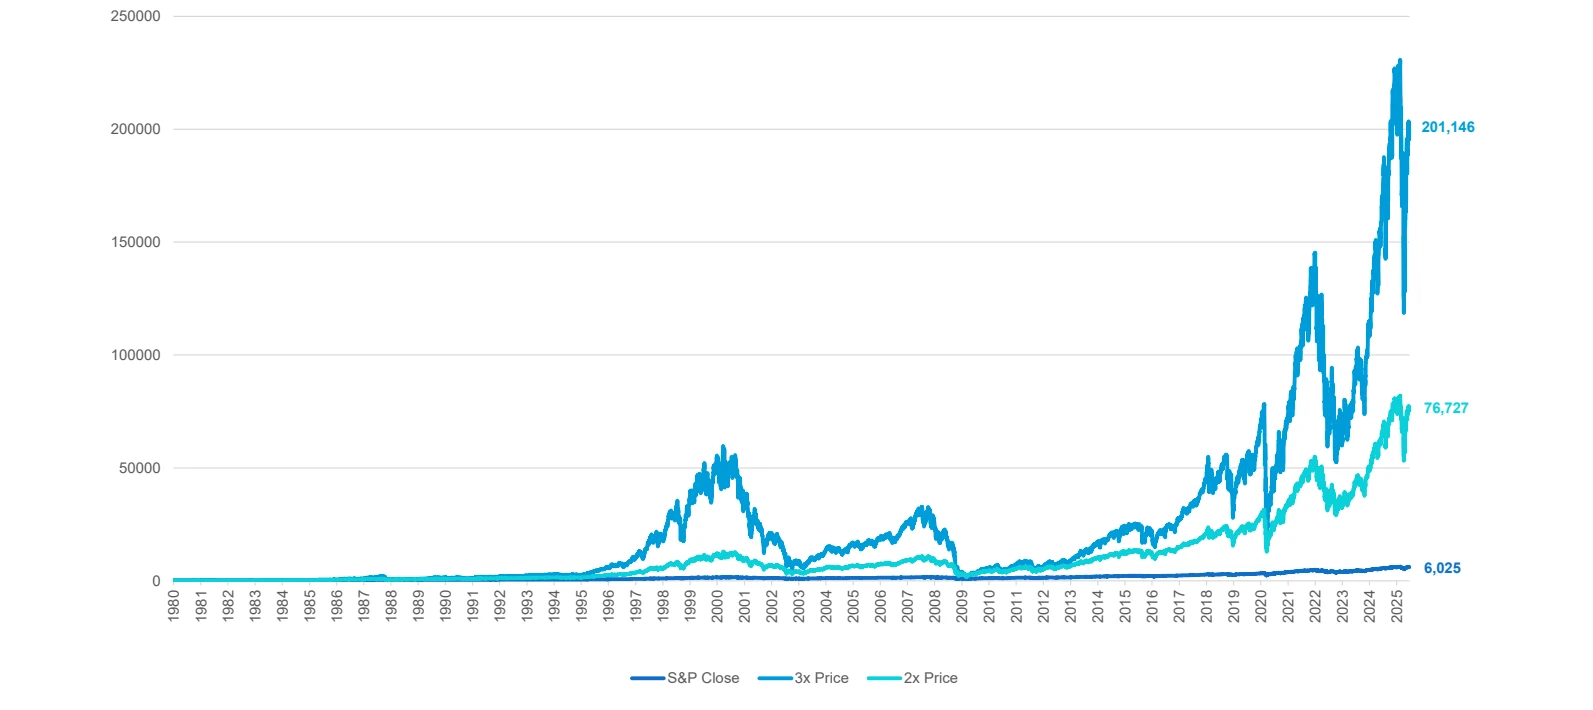
Buy-and-hold: S&P 500, 2x and 3x back-test, 1980 – today. Original chart; “today” is 23 June 2025.
Buy-and-hold: 2000 – Today
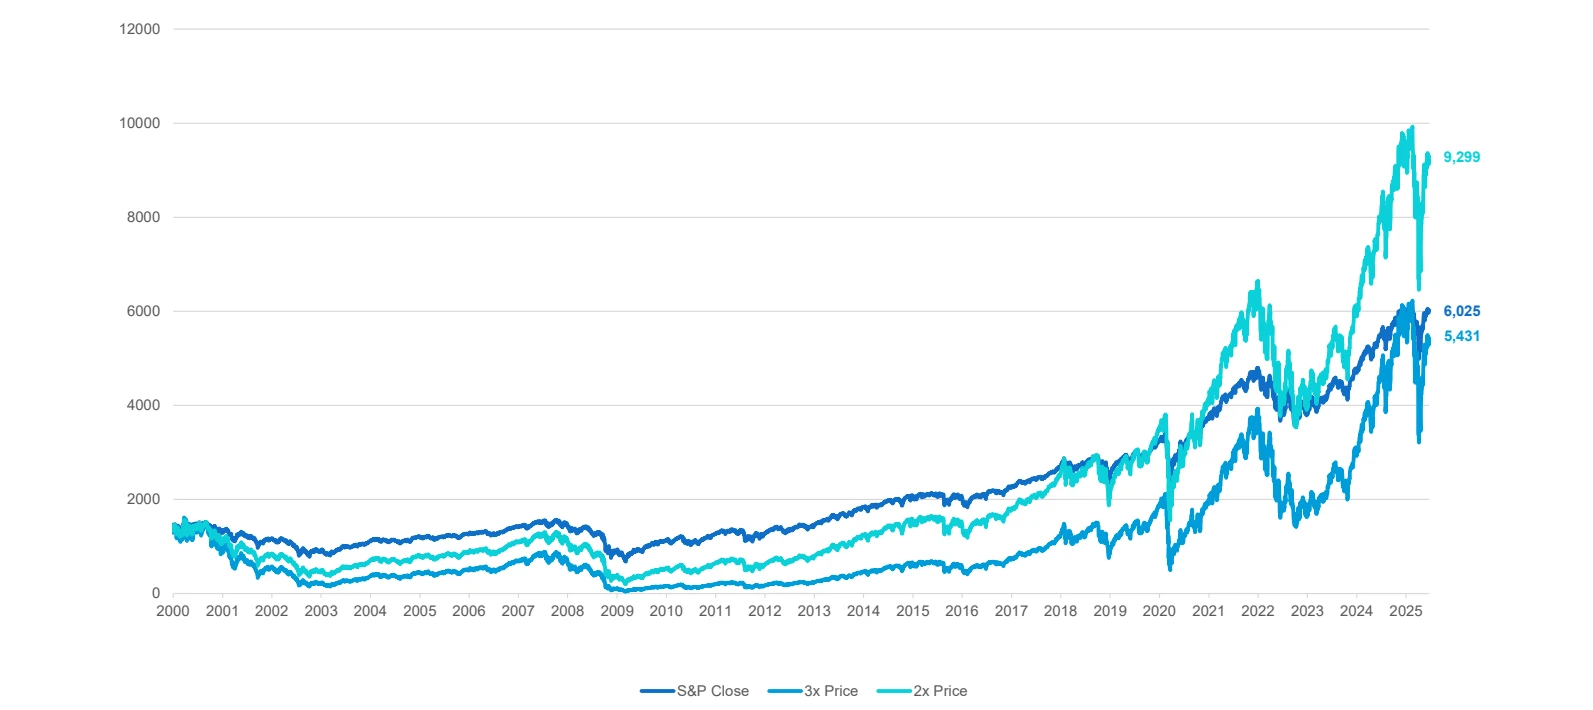
Buy-and-hold: S&P 500, 2x and 3x back-test, 2000 – today. Original chart; “today” is 23 June 2025.
Buy-and-hold: 2007 – Today
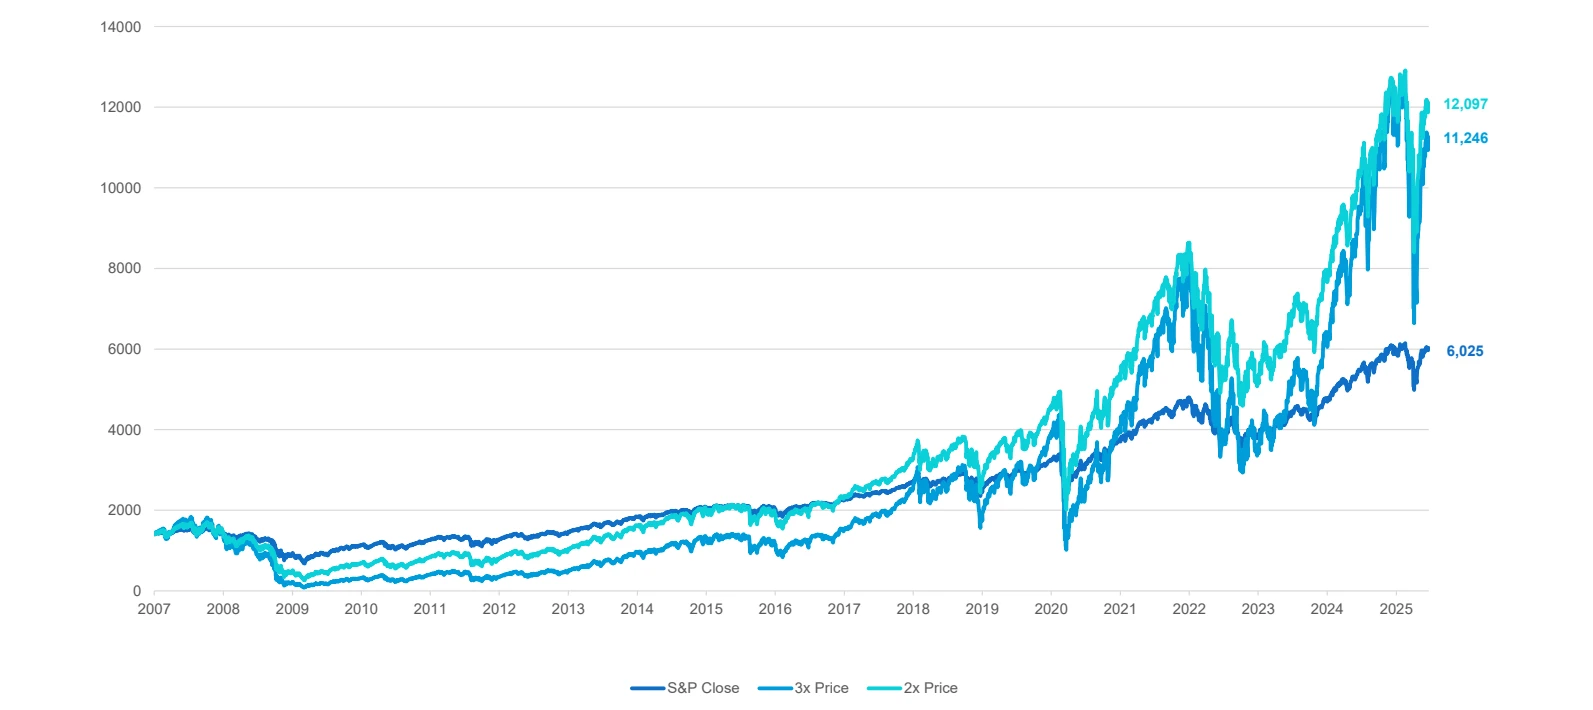
Buy-and-hold: S&P 500, 2x and 3x back-test, 2007 – today. Original chart; “today” is 23 June 2025.
Buy-and-hold: 2020 – Today
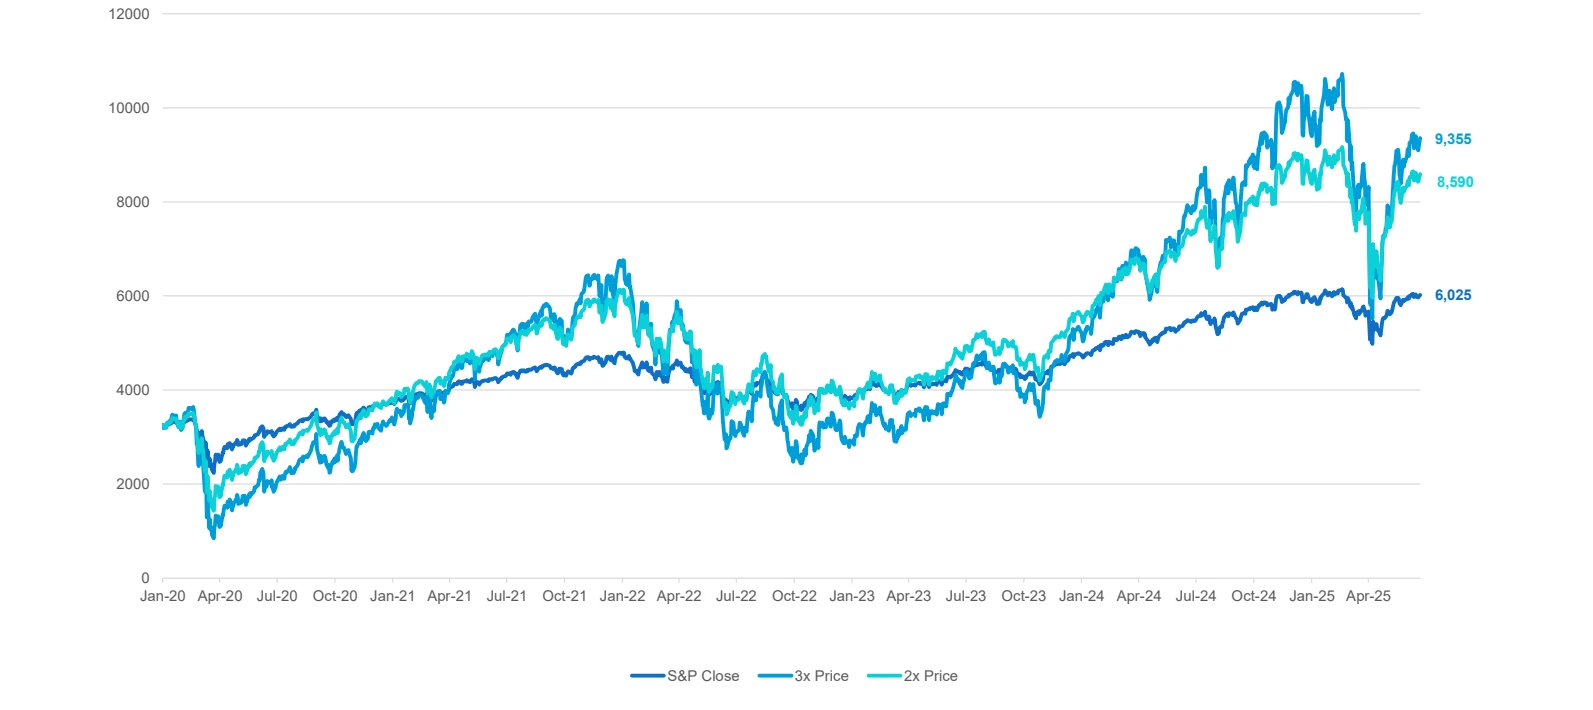
Buy-and-hold: S&P 500, 2x and 3x back-test, 2020 – today. Original chart; “today” is 23 June 2025.
DCA Back-test
- These chart represent the value an investor’s portfolio would gain if they invested $1 of each hypothetical portfolio every day at its close price
- 1980 – today: four-plus decades of largely upward markets let the 3x fund compound to ~2.1 million, roughly 15x the ending value of the un-levered stream (~139k). Continuous contributions buy extra shares after every pull-back, so later bull markets dominateand volatility drag becomes comparatively small
- 2000 – today: beginning at the peak of the dot-com bubble injects two deep bear cycles, yet a steady DCA lifts the 3x series to ~87k versus ~57k for 2x and ~24k for SPX
- 2007 – today: DCA again reduces the risk of the levered portfolios. The final values are ~64k (3x), ~36k (2x), and ~14k (SPX)
- 2020 – today: a short, extremely volatile window spanning the Covid shock and a rapid recovery shows smaller absolute numbers but the same order: 3x finishes at ~3.2k, 2x at ~2.6k, SPX at ~1.96k. With fewer prolonged draw-downs, the gap between 3x and 2x narrows; path dependence still matters, just less dramatically over four years
Daily $1 contributions: 1980 – Today
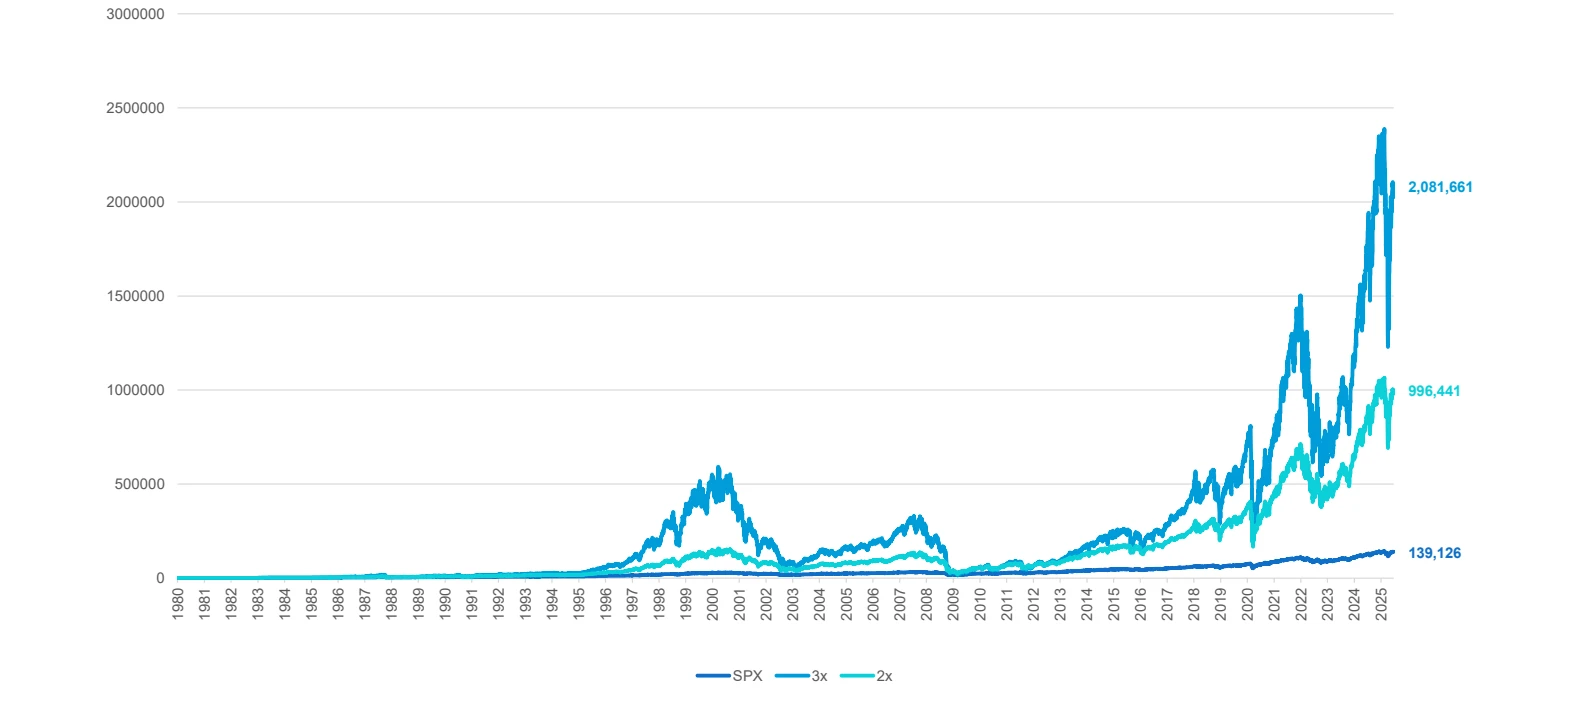
Daily $1 contributions: S&P 500, 2x and 3x back-test, 1980 – today. Original chart; “today” is 23 June 2025.
Daily $1 contributions: 2000 – Today
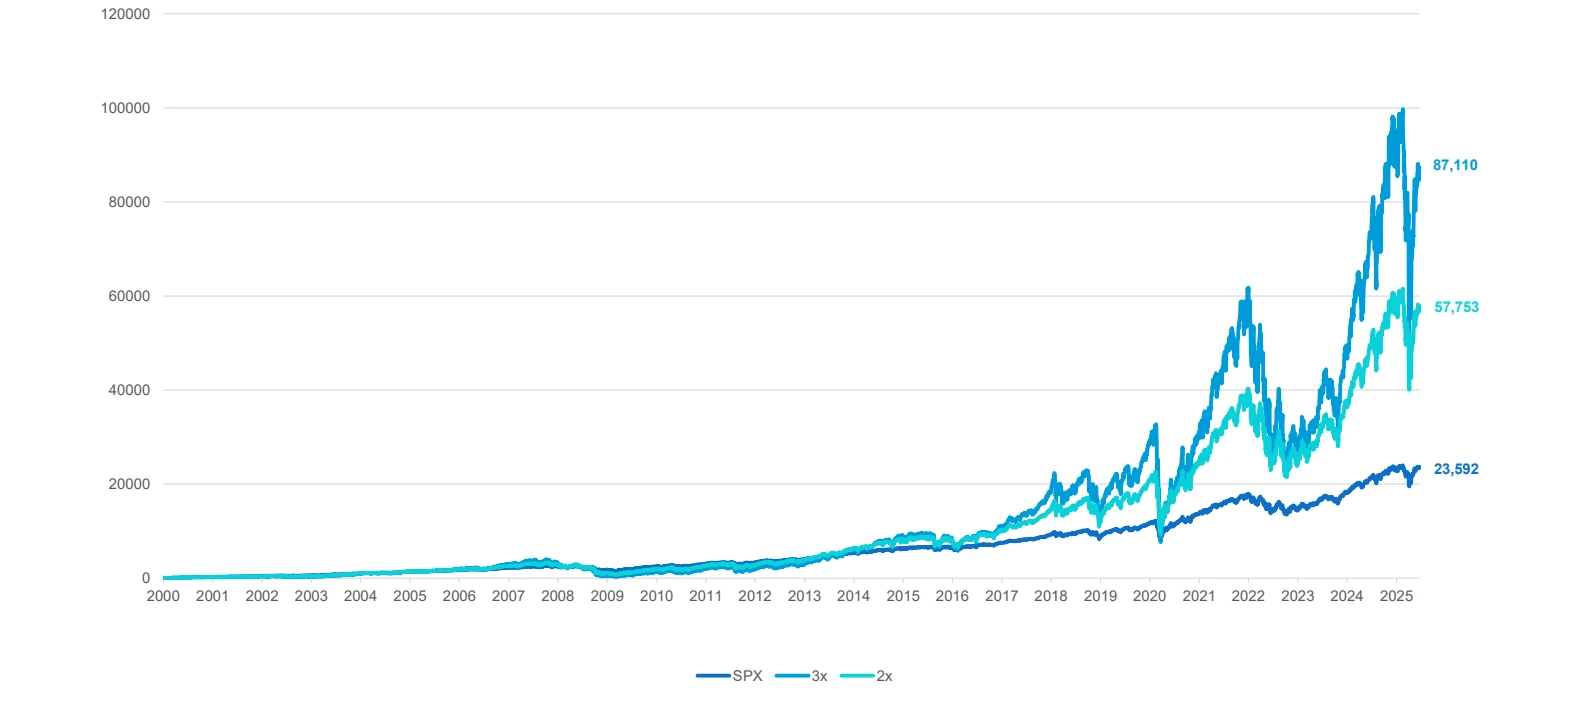
Daily $1 contributions: S&P 500, 2x and 3x back-test, 2000 – today. Original chart; “today” is 23 June 2025.
Daily $1 contributions: 2007 – Today
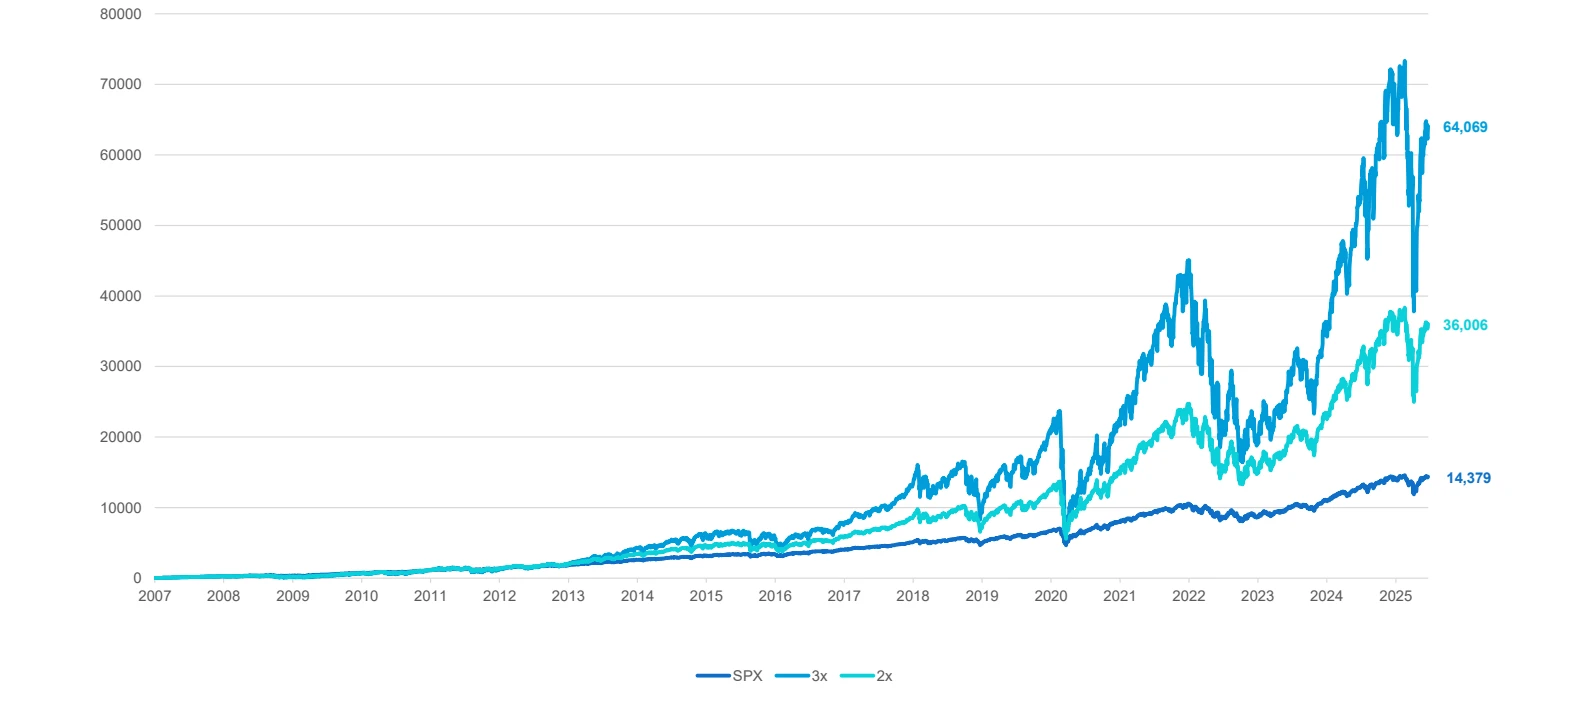
Daily $1 contributions: S&P 500, 2x and 3x back-test, 2007 – today. Original chart; “today” is 23 June 2025.
Daily $1 contributions: 2020 – Today
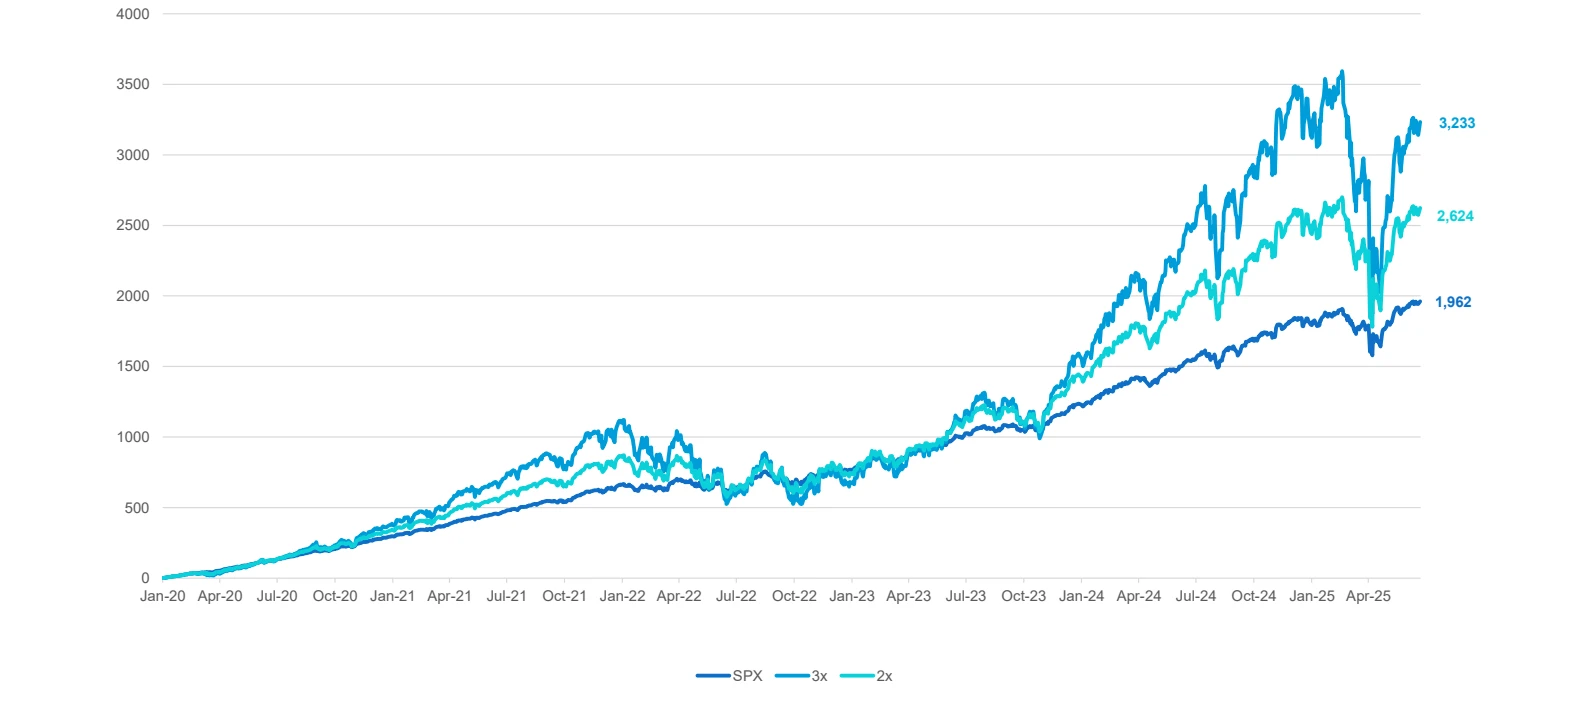
Daily $1 contributions: S&P 500, 2x and 3x back-test, 2020 – today. Original chart; “today” is 23 June 2025.
Key Takeaways
- Continuous contributions mute the effect of volatility drag. New dollars enter at whatever price the market offers, so deep sell-offs buy more “units” that ride the next upswing under large leverage multipliers.
- Consequently, 3x beats 2x and both outpace the un-levered index across every start date tested
- These broad marketindexes have never been completely “wiped out” due to a one day drop
- Realistically, market circuitbreakers would kick in before this would happen, halting trading and eliminating the risk of a 100% loss (in one day).
- This has happened to industry/commodity/company specific leveraged funds, such as leveraged oil ETNs dropping to zero following the COVID panic.
- Some Caveats remain:
- Real-world leveraged ETFs bear transaction costs, financing spreads and management fees that would lower the 2x/3x returns
- Higher volatility still translates into larger interim draw-downs; an investor must stomach swings much wider than the ultimate out-performance suggests
- If the index were flat or steadily declining for an extended period, the ranking could invert despite a DCA strategy
- Overall, in a long-run, a rising market punctuated by sharp but temporary sell-offs, dollar-cost averaging systematically into a daily-reset leveraged fund has historically multiplied wealth far faster than the same schedule applied to the underlying index, provided the investor can tolerate the journey